Resource utilization chart lets you view user workload and optimize utilization based on business needs.
Global Resource Utilization Chart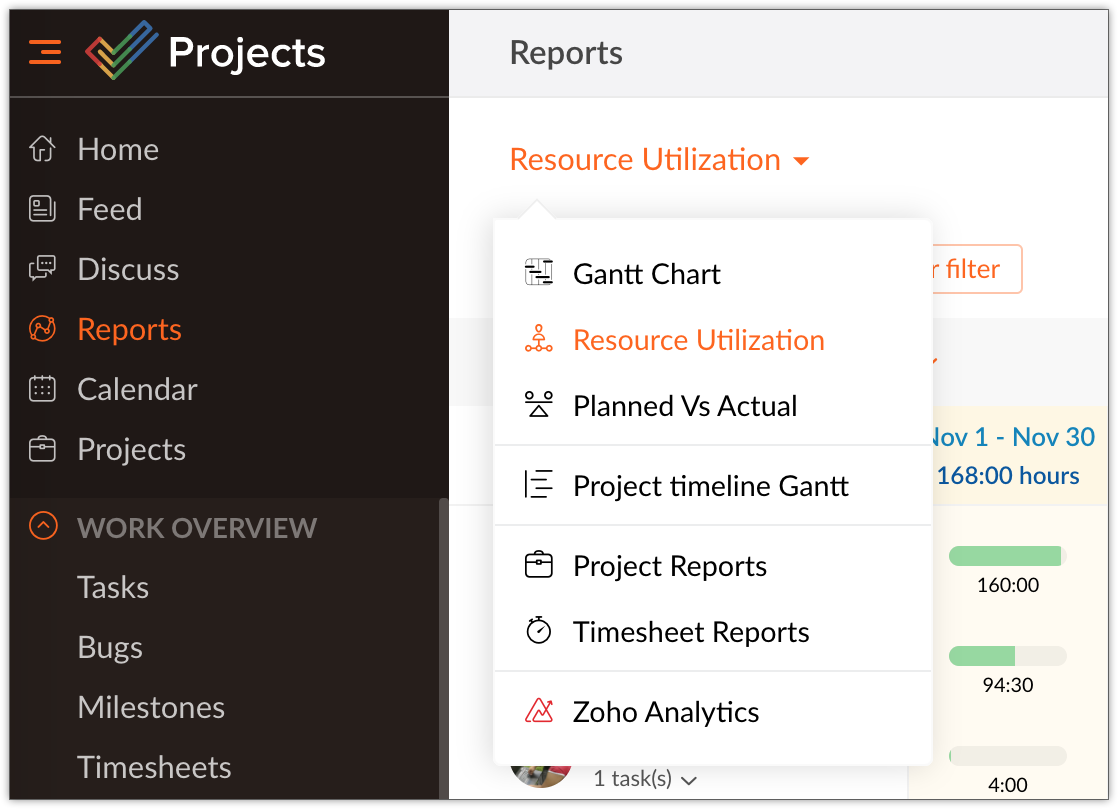
Bar View
The bar view shows
Drag and drop tasks from one user to another to re-balance workload.
The Resource Utilization chart visually shows the allocated work in hours and percentage. The idle time is reflected. When a resource is overloaded, you can reschedule it to either an other resource or another day with available business hours. You can directly add tasks on the chart for any selected user. Search Users to quickly view their work load.
Filters in Resource Utilization Chart:
Filter the data based on Users, Teams, Period, Allocation type, Work Time Unit, and Task Status.
Recurring Tasks in Resource Utilization Chart
The recurring tasks are displayed virtually Resource utilization charts based on their recurring frequency. Only the recurring task that is active is displayed as task bar, whereas the remaining recurring tasks are displayed in dotted lines, just as a reminder about the project schedule. You can edit only the active recurring tasks; the virtual recurring tasks cannot be edited. And neither can you perform any actions on those virtual tasks.
Heatmap View
Resource utilization chart now shows the resource allocation as a heatmap.
Heatmap against each resource.


